
Norway
Oslo
Norway
Oslo
Suite 5, Plaza 256, Blanchardstown Corporate Park 2, Dublin 15, D15 VE24, Ireland
+353 1 531 4791Our OfficeFloor 3 East - 3E - 501 5th St - Dubai Int'l Airport, Dubai Airport Free Zone (DAFZA), Dubai, United Arab Emirates
+353 1 531 4791GLOBAL PRESENCE
Local leadership. Global engineering excellence. Delivering software solutions across Europe and Asia-Pacific.
World map showing Dev Centre House office locations
With over 12 years of experience, Dev Centre House Ireland has been empowering clients across the globe, delivering more than 100 successful projects, including those in data analytics and visualisation. Our skilled data engineers at Dev Centre House Ireland utilise a comprehensive range of data visualisation tools to accurately identify market trends and provide insightful business assessments.
Clients
Scope
In the initial stages of business development, managing large volumes of data can be challenging, often leading to delays in project progression. At Dev Centre House Ireland, we offer data visualisation services designed to help you effectively manage and interpret your data. Our comprehensive suite of services includes:
Our data consultants assist you in identifying and selecting valuable data, enabling cost optimisation across all business sectors and uncovering innovative solutions.
The experts at Dev Centre House Ireland implement reliable and user-friendly data visualisation solutions, allowing you to extract meaningful data and gain new insights into your target audience's needs.
We specialise in developing data visualisation platforms that enable seamless data integration from various sources, establish centralised data repositories, ensure robust data protection, and enhance reporting and final visualisation.
Dev Centre House Ireland creates bespoke data visualisation solutions tailored to clients worldwide, helping businesses identify emerging trends and respond swiftly to changes.
Enhance your business analytics with tailored dashboards and reports that display the key metrics essential for your company’s growth.
Our team of data engineers can refine your existing data management framework by optimising processes or reducing reliance on manual data entry.
Technological Stack Expertise
At Dev Centre House Ireland, we are proficient in a wide range of data visualisation tools and technologies, enabling us to transform complex data into clear, actionable insights. Our expertise spans across the latest industry-standard tools, ensuring that your data is presented in an engaging and comprehensible manner. We focus on delivering visualisations that not only look impressive but also drive informed decision-making for your business.
Stay ahead with our innovative solutions and a talented team that drives your success.
Process
At Dev Centre House Ireland, we tailor our approach to meet the unique needs of each client, ensuring the most appropriate data visualisation solutions. Here's how we manage the entire data workflow process:
We start by gathering all relevant data from the various sources provided. This data is then collated, refined, and captured for analysis.
The next step is data cleaning, a crucial process that guarantees the quality and accuracy of the final visualisations.
We then structure the primary data, categorizing it into different groups and subgroups.
Prior to finalising, we filter the data to remove any unnecessary information, enhancing the clarity and precision of the results.
The processed data is then transformed into charts, diagrams, tables, and maps, with templates carefully selected to best represent the information.
Finally, we engage in feedback and fine-tuning of the visualisations according to the client's specifications.
Yearly 500+ million dollar turnover company via software developed by Dev Centre House Ireland.
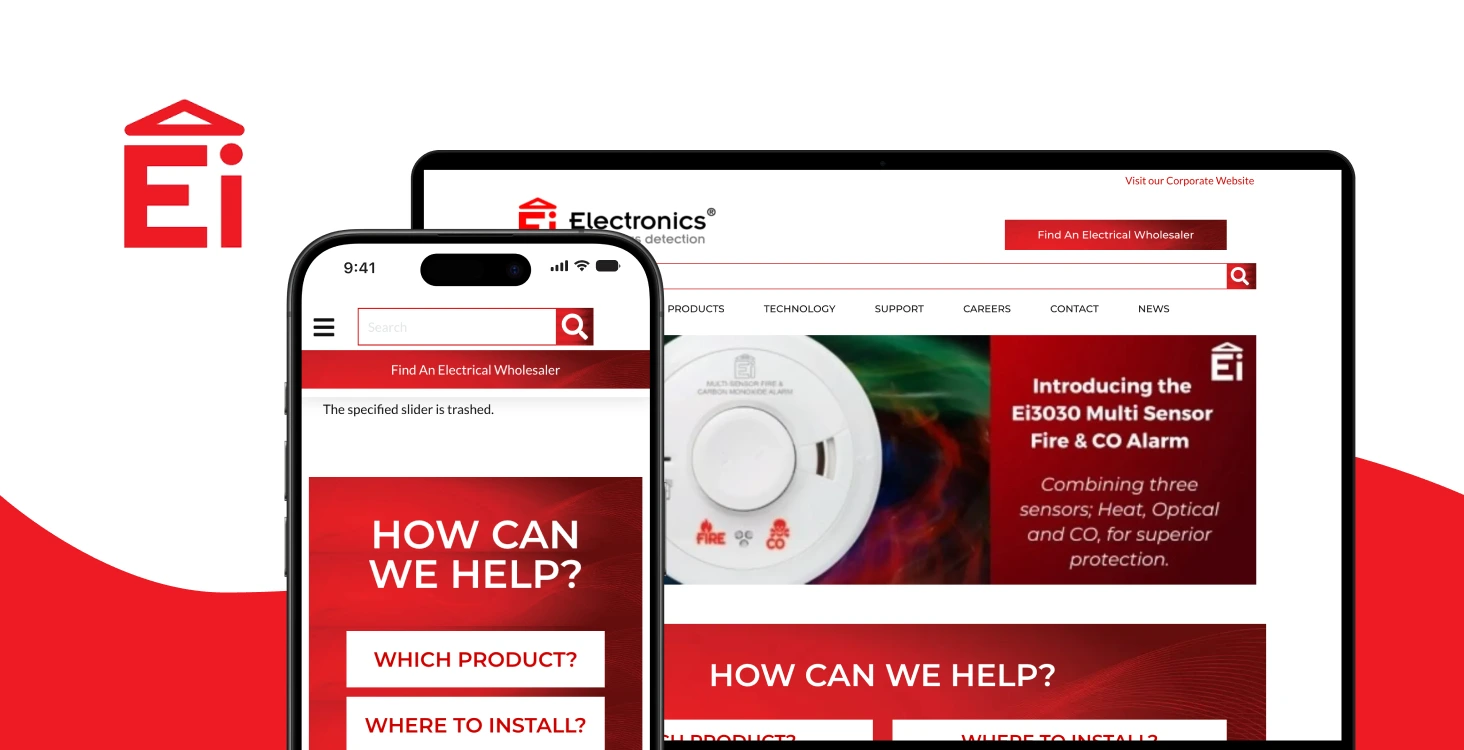
Headquartered in Ireland we are a global leader in the manufacture of residential fire and carbon monoxide detection products. They manufacture over 10 million products.
Our managers who interact with Dev Centre House Ireland are all in agreement that this is an outstanding company. They are meticulous, patient, and extremely capable. The most impressive factor is that they feel like a partner, and it is very clear that they understand and value our business aims.
Jim Murray
Operations Director at Prosperity.ie
Dev Centre House Ireland has constantly under-promised and over-delivered. We couldn't be happier. Their level of professionalism, confidentiality, work ethic, and attention to detail. DCH is deeply vested in the process and outcome. We find DCH utmost professional and competent, on time and on target.
Anonymous
Chief Executive Officer at SaaS Company
There were no delays. They presented things quickly to me. They were very good. Dev Centre House Ireland has good ideas in the pipeline for us to do. They’re up-to-date on their technology.
Edel McDonnell
Owner of KingFisher Restaurant
Dev Centre is always looking for alternative ideas to enrich value, and their style is complementary and grateful. They show interest in our business and underlying assets. They do an excellent job. They’re disciplined, keep meetings on track, and give detailed updates.
Fintan Knight
Chief Executive Officer at Automotive Equity Management Ltd.
What we found most impressive was their commitment to delivering an excellent result. We felt they never stopped working as soon as the project started, not even on the weekends. The commitment was extraordinary.
Bob Khanna
Office Manager at Aesthetic Clinic
Fill out the form below or schedule a call and we will be in touch. * indicates a required field.