Explore how Cork startups can leverage data visualisation to attract investors and enhance growth metrics.
Attracting investors in today’s competitive landscape requires more than just an innovative idea; it demands clear communication of growth potential. Data visualisation has emerged as a vital tool for Cork startups, enabling them to present complex information in an easily digestible format. By leveraging effective visualisation techniques, startups can significantly enhance their appeal to potential investors.
The ability to simplify intricate data sets is essential. With well-designed dashboards, Cork startups can showcase their traction and unit economics, making a compelling case for investment. The right visual tools can transform raw data into narratives that resonate with decision-makers, ultimately influencing investment outcomes.
The Importance of Data Visualisation in Attracting Investors
The current landscape for Cork startups is both vibrant and challenging. As the tech ecosystem grows, the need for effective communication of growth metrics has never been more critical. Data visualisation plays a key role in this process, helping startups to distill complex information into clear, actionable insights.
Visualisation tools can simplify the presentation of growth metrics, allowing startups to convey their value proposition without overwhelming potential investors. Clear dashboards serve as an effective means to showcase traction, enabling stakeholders to grasp essential information quickly and efficiently.
Local Challenges Faced by Cork Startups in the Digital Age
Cork startups encounter several challenges in the digital landscape. High competition within the tech ecosystem means that standing out is essential. Many startups struggle to communicate their growth metrics effectively, which can hinder investment opportunities.
Additionally, limited access to investor networks and funding opportunities poses a significant barrier to growth. Startups must navigate these local challenges while striving to present their data in a manner that attracts the right investors.
The Power of Data Visualisation for Cork Startups
Data visualisation can highlight key performance indicators crucial for attracting investment. By presenting clear visuals, Cork startups can articulate their growth story more effectively. This not only captures the attention of investors but also builds credibility.
Examples of Successful Cork Startups Using Data Visualisation
Some Cork startups have already begun harnessing the power of data visualisation. For instance, a local fintech startup effectively used dashboards to secure funding by illustrating their growth trajectory and market potential. Similarly, a manufacturing startup showcased operational efficiency through compelling visual data, demonstrating how they optimise resources and drive profitability.
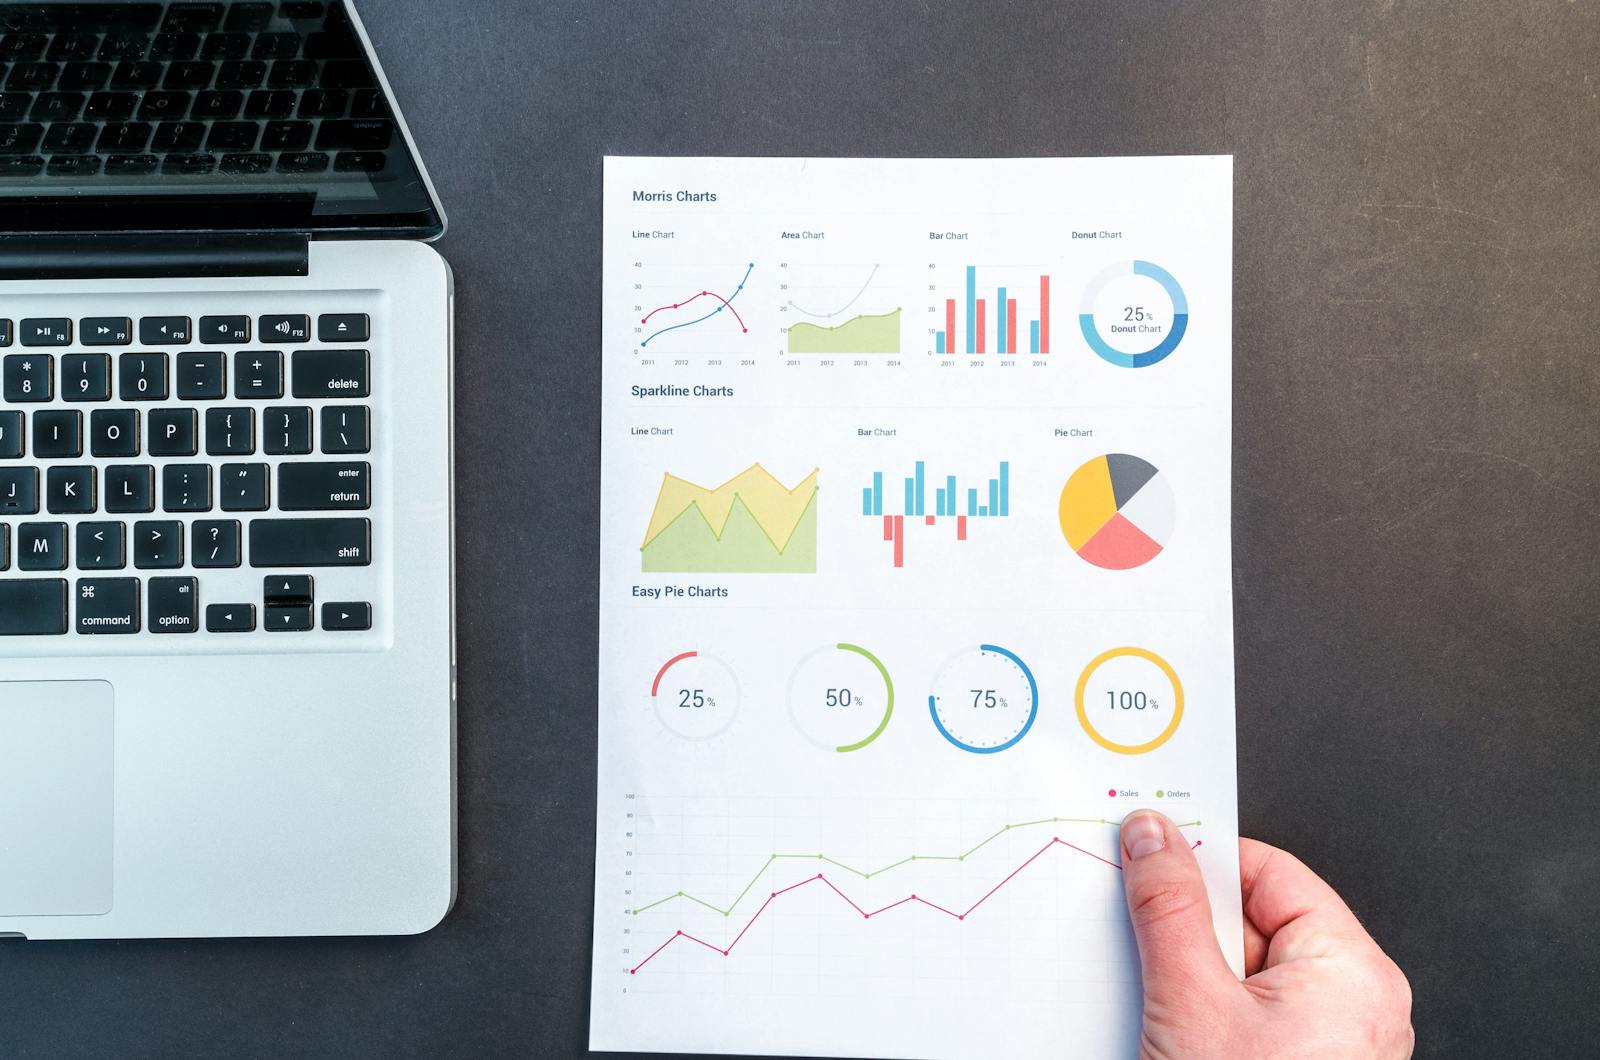
Essential Tools for Data Visualisation
Choosing the right data visualisation tools is crucial for Cork startups looking to enhance their presentations. Several popular software options cater to the needs of local businesses.
- Tableau: Widely used for its user-friendly interface and strong community support.
- Microsoft Power BI: Integrated tools that cater to local businesses’ needs.
- Google Data Studio: Cost-effective solutions for startups with budget constraints.
- Local alternatives: Highlight any Cork-based or Irish solutions that are gaining traction.
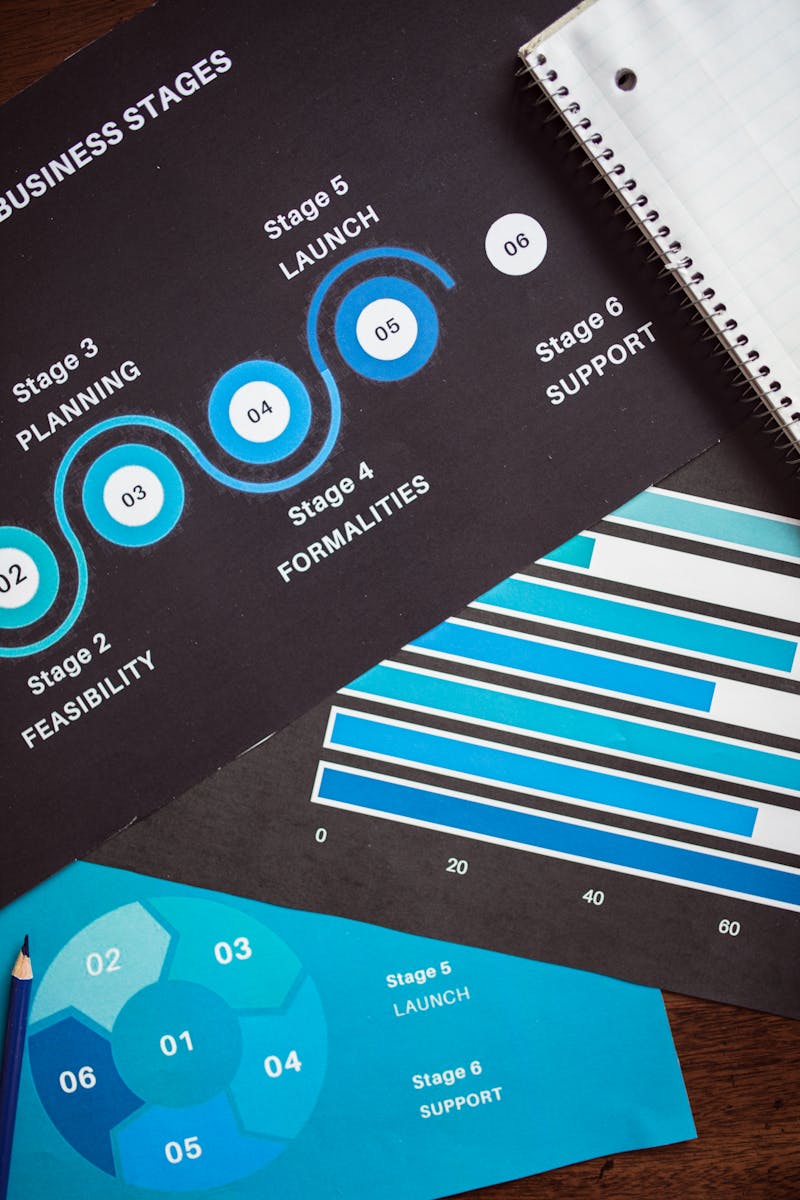
How to Create Effective Dashboards for Investor Presentations
Designing effective dashboards is key for investor presentations. Startups should focus on essential metrics that convey their growth story clearly. A well-structured dashboard can facilitate better discussions with potential investors.
Best Practices for Designing Dashboards
- Keep it simple: Focus on essential metrics.
- Use visuals wisely: Incorporate graphs and charts that tell a story.
- Tailor to your audience: Customise dashboards for specific investor interests.
The Role of Dev Centre House in Fostering Startup Success
Dev Centre House offers a range of services that can assist Cork startups in optimising their data visualisation efforts. By partnering with a local software development company like Dev Centre House, startups can access tailored solutions that align with their specific needs.
Choosing a local partner ensures that Cork startups receive insights and support relevant to their unique challenges, ultimately enhancing their ability to attract investment through effective data visualisation.
The Future of Data Visualisation in Cork’s Tech Landscape
Emerging trends in data visualisation and analytics present exciting opportunities for Cork startups. As technology evolves, there are potential growth areas for startups that leverage these innovations to enhance their offerings.
Government support and local initiatives play a crucial role in promoting tech innovation in Cork. By staying abreast of these developments, startups can position themselves advantageously in a rapidly changing landscape.
Conclusion
Cork startups have a unique opportunity to harness the power of data visualisation to attract investors. By effectively presenting their growth metrics and operational efficiencies, they can significantly enhance their appeal. Exploring partnerships with Dev Centre House can provide the necessary support to develop effective data strategies that resonate with potential investors.
FAQs
How can data visualisation improve my startup’s pitch to investors in Cork?
Data visualisation enhances your pitch by presenting complex information clearly. This allows investors to grasp your growth metrics quickly, making your startup’s value proposition more compelling. By showcasing essential data visually, you can foster confidence and interest among potential investors.
What are the most effective data visualisation tools for startups in Cork?
Effective tools for Cork startups include Tableau, Microsoft Power BI, and Google Data Studio. These platforms offer user-friendly interfaces and features tailored to local business needs, helping startups present their data in a visually appealing manner that resonates with investors.
How can I measure the impact of data visualisation on my startup’s funding success?
While direct measurement may be challenging, you can assess the impact of data visualisation by tracking investor engagement and feedback during presentations. Observing changes in investor interest and follow-up discussions can provide qualitative insights into the effectiveness of your visualisation strategies.
What common mistakes should Cork startups avoid when creating dashboards?
Startups should avoid cluttered dashboards that overwhelm users. Focusing on too many metrics can dilute your message. It’s essential to keep your visuals simple and tailored to your audience’s needs, ensuring clarity and impact in every presentation.
How can Dev Centre House assist my startup in enhancing its data visualisation strategy?
Dev Centre House can provide tailored solutions that optimise your data visualisation efforts. With expertise in software development and local market knowledge, they can help you design effective dashboards and implement strategies that resonate with investors and enhance your startup’s growth potential.